This page is part of a guide on scaling circular business models in fashion. The insights here have been developed from analysis of the fashion sector, but will be relevant to other sectors.
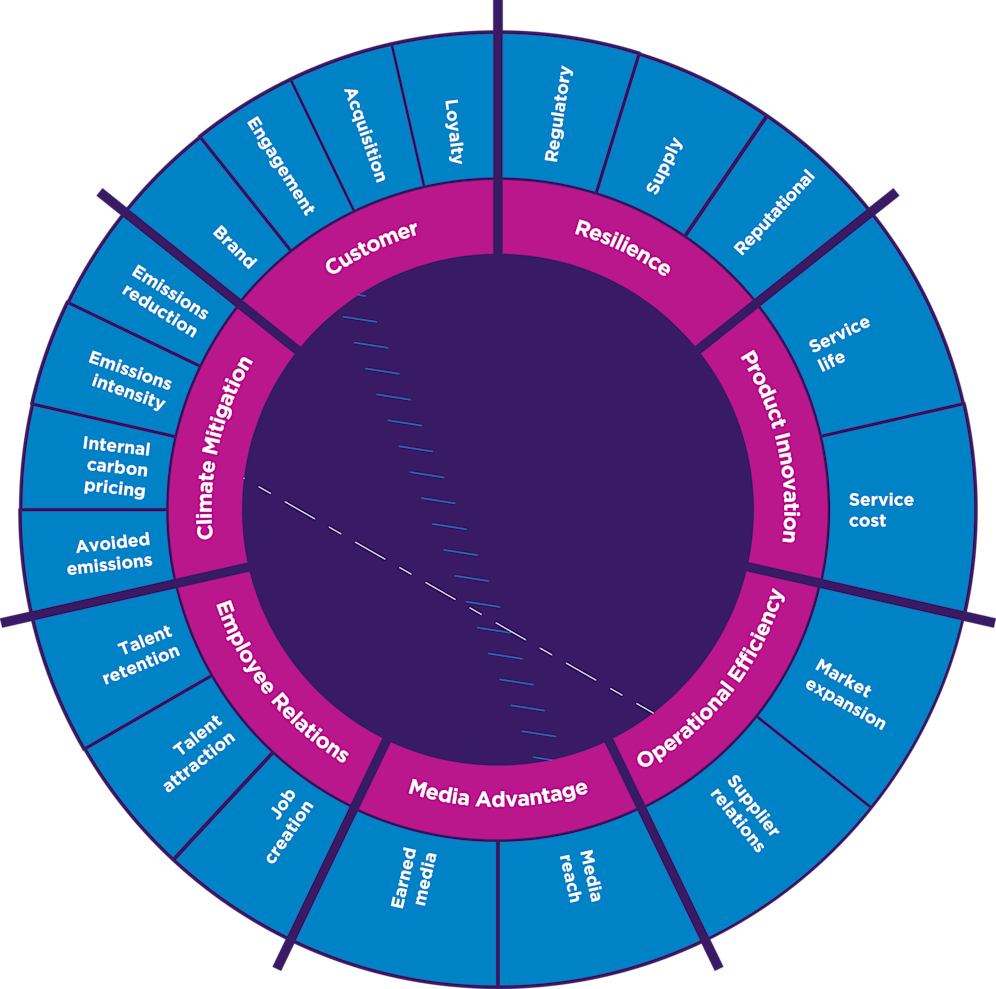
The Foundation, with input from NYU Stern Center for Sustainable Business, signposts seven key benefit areas and 50+ metrics that can be used for quantifying the value and the impact of circular business models today.
Leading businesses are shifting their success metrics beyond short-term profit to embrace the long-term strategic advantages of circular business models. Certain metrics clearly indicate financial value (monetary). Other benefits are tied to overall business performance (non-monetary). Whether for decision-making or evolving Key Performance Indicators (KPIs), quantified impact is essential for bringing internal stakeholders on board.
The metrics table (non-exhaustive) can be navigated by:
Benefit area: the high-level opportunities from circular business models
Metric category: how the benefit area is divided into sub-benefits, such as those relevant for a specific team or Key Performance Indicator (KPI).
Metric example: a specific use case that can demonstrate the benefit and quantified impact
Monetised vs non-monetised: which metric examples indicate financial value (monetary) vs non-financial business value (non-monetary)
Direct vs indirect: whether the metric example provides an immediate benefit to the business (direct) or contributes to the broader impact of adopting a circular business model and transitioning away from a linear model (indirect)


When it comes to showcasing the opportunity for circular business models, there is no one-size-fits-all approach. A combination, or prioritisation, of which metrics to include is often determined by audience, business model, and strategy. The full suite of metrics can support you in identifying which data is most aligned with an organisation’s strategy towards building an evidence base.


